Purpose: Determine fastest small NAS/SAN OS/Appliance software solution for home running under ESXi.
Constraints: Candidates must support ZFS, be relatively stable (I narrowed down my candidate list by only choosing solutions that other people have used successfully), and be able to run CrashPlan for data protection.
If you’re not familair with ZFS (Zettabyte File System), read ZFS – The Last Word on File Systems:
OS/Appliance candidates

- Solaris 11 + napp-it. The latest OS release from Oracle. For this test the text installer was used. Solaris 11 is free for development and personal use but a support license is required for commercial use.
- OpenIndiana Server 1.51a + napp-it. The fork off of Open Solaris when Oracle closed the project. For this test the server installation ISO was used. Open Indiana is free to use with no restrictions.
- NexentaStor 3.1 Community Edition. Based on Open Solaris with a Debian based user-land. Nexenta has built a great web GUI making it easy to setup a ZFS system. I used Nexenta’s built-in gui instead of napp-it. NexentaStor Update 2/19: is free to use with up to 18TB of net storage (a limit that would be pretty hard to hit for a small home SAN/NAS), after that a license is required. does require a license for anything more than development and evaluation.

napp-it, is a web gui for running on top of OpenIndiana, Solaris 11, Nexenta, and a few others written by Günther Alka (aka Gea). It’s one command to install and you have a web-interface to your OS for setting up your storage appliance. I think Nexenta’s GUI is a little more polished and faster (you get stats, graphs, Ajax, etc.), but Gea’s Napp-it is solid and very light-weight. When joining a WinServer 2008 R2 domain Napp-It had no problems, but I had to drop to a command shell to tweak some settings to get Nexenta to join. The ACLs were also a bit easier to get going in Napp-It. Overall I would say Nexenta is a little easier to use than Napp-It (I usually don’t have to dig too far into the menus to find something in Nexenta), but Napp-it won’t eat up as much memory.
Below is the testing environment:
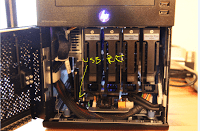
Hardware Configuration
- HP ProLiant Microserver
- CPU: AMD Turion II Neo 1.5GHz
- Memory: 8GB (2x4GB) PC3 – 10600 ECC
- HD: 250GB Seagate 7200 RPM SATA (I really wanted to perform the test with more drives but with the prices of drives after the Thailand floods it wasn’t affordable.)
- Everything else is stock configuration.
Virtualized Environment
- VMWare ESXi 5.0 installed on a 2GB SanDisk Cruzer
- The SATA controller on the Microserver does not support pass through on ESXi so I wasn’t able to give the OS direct access to the drive. VM files were used for the drives.
VM Configuration
Each OS was installed on the Seagate drive, it was given 4GB Memory, 30GB of storage for the OS and 40GB for the share/test drive, and both CPU cores. During testing all other VMs were powered down.
Network
Gigabit network all around, using Cat-5e cables (sorry, I don’t have any Cat-6 cables) through as Cisco/Linksys E3000 (gigabit router) running TomatoUSB. I shutdown all programs that I thought would use a significant amount of network traffic.
NAS Share configuration
Shares were mounted via CIFS/SMB. I did not test NFS since I don’t have a system outside the Virtual Server that can mount NFS shares. CIFS shares were using standard sync, the default compromise between safety and performance.
Shares were mounted via CIFS/SMB. I did not test NFS since I don’t have a system outside the Virtual Server that can mount NFS shares. CIFS shares were using standard sync, the default compromise between safety and performance.
SAN Share Configuration
The difference between a NAS and a SAN is a NAS shares a file-system, multiple people can access that system at the same time. A SAN shares volumes at the block level so it’s more suitable for running a database on top of, but only one client can mount a SAN target (volume) at a time. iSCSI targets were mounted from my Windows 7 desktop. I setup the iSCSI pools to use up to 128K blocks, after thinking about it I should have used 512 byte blocks since that’s what the OS would expect, ZFS will automatically use the smallest block-size it can to fit the file-system blocks so the block-size would have been whatever NTFS defaults to when formatting a 10GB drive.
Testing Software
Crystal Mark 3.0.1 x64. Tests set to repeat 3 times each. Test size 100MB, test data set to random.
Tests Performed
- Seq = Sequential Read/Write of 100MB.
- 512K = Random Read/Write of 512K files (100MB worth).
- 4K = Random Read/Write of 4K files (100MB worth).
- 4KQD32 = Random Read/Write of 4K files (100MB worth) using a queue depth of 32.
ZFS Configurations
- Standard – Typical ZFS share with nothing special.
- Compression – LZJB Compression of each block.
- Compress_Dedup – LZJB Compression of each block, and block level deduplication.
- Gzip – Gzip-6 compression of each block.
- Gzip9 – Gzip-9 compression of each block.
- iCSCI, Compression – iSCSI target (block level shares) using LZJB compression.
Shortcomings with this test
- My network should be on Cat-6, but I’m too cheap.
- If my SATA-controller supported pass-through with ESXi, ZFS would use the disk cache resulting in faster speeds.
- I only had a single 7200RPM HD available, we could have seen different results (likely faster across the board) with 3 or 4 drives in a RAID-Z setup, but that’s not going to happen until prices normalize.
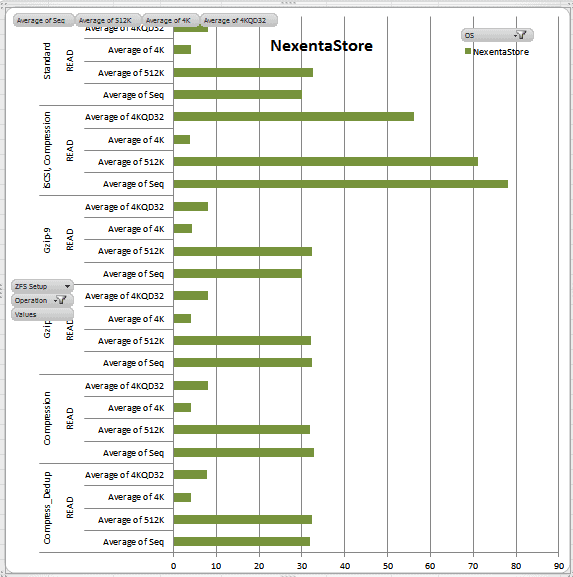
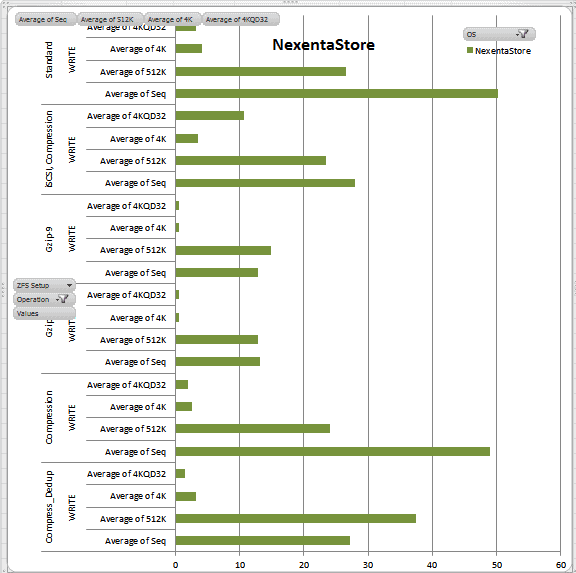
Here are the test results.
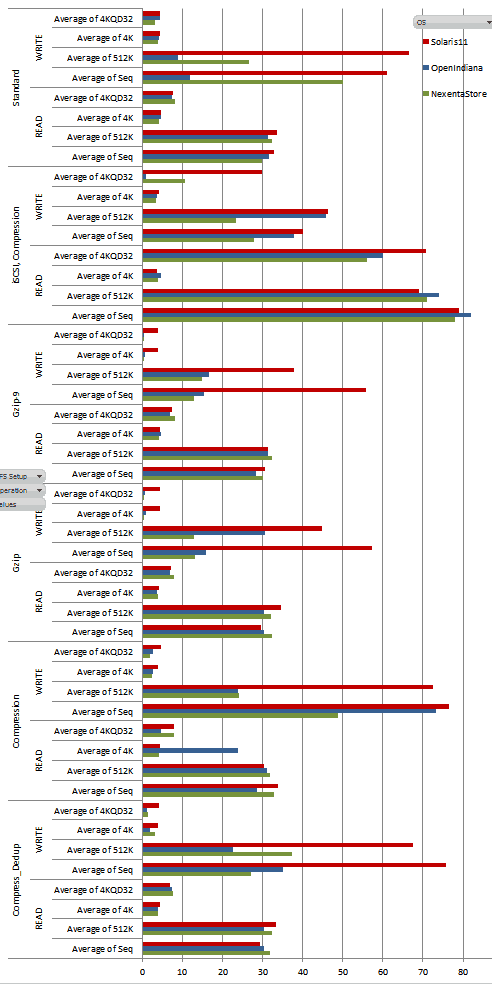
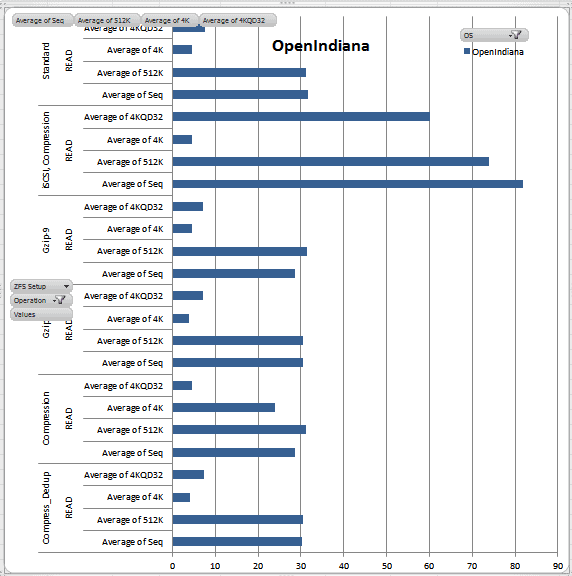
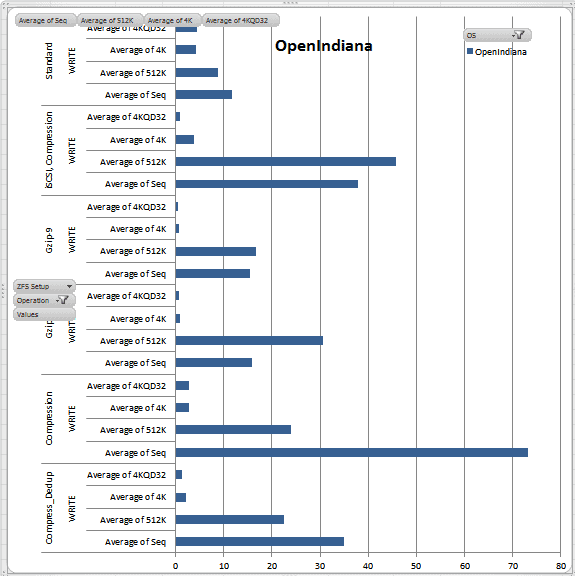
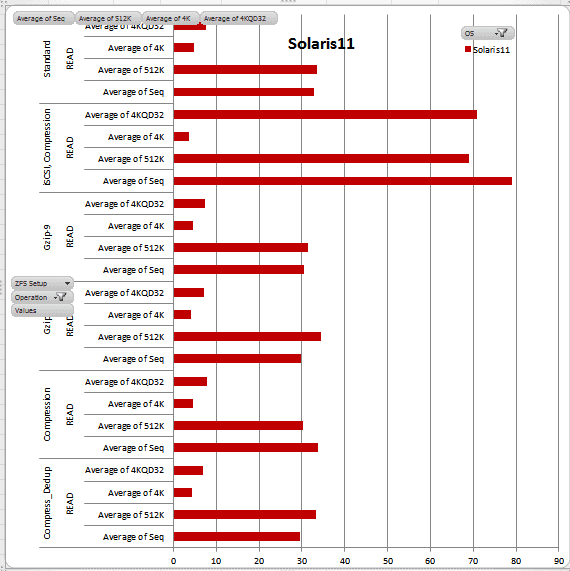
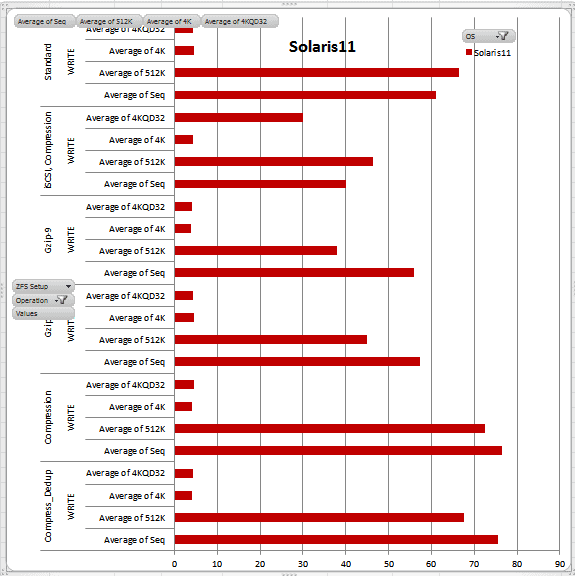
Below are some specific OS Graphs (note that the scale changes with each one).
Pivot Data
| Column Labels | |||
| Row Labels | NexentaStore | OpenIndiana | Solaris11 |
| Compress_Dedup | |||
| READ | |||
| Average of Seq | 31.83 | 30.28 | 29.49 |
| Average of 512K | 32.34 | 30.5 | 33.33 |
| Average of 4K | 4.037 | 4.028 | 4.406 |
| Average of 4KQD32 | 7.713 | 7.392 | 6.94 |
| WRITE | |||
| Average of Seq | 27.2 | 35.07 | 75.65 |
| Average of 512K | 37.48 | 22.59 | 67.54 |
| Average of 4K | 3.244 | 2.082 | 3.992 |
| Average of 4KQD32 | 1.469 | 1.322 | 4.261 |
| Compress_Dedup Average of Seq | 29.515 | 32.675 | 52.57 |
| Compress_Dedup Average of 512K | 34.91 | 26.545 | 50.435 |
| Compress_Dedup Average of 4K | 3.6405 | 3.055 | 4.199 |
| Compress_Dedup Average of 4KQD32 | 4.591 | 4.357 | 5.6005 |
| Compression | |||
| READ | |||
| Average of Seq | 32.77 | 28.61 | 33.77 |
| Average of 512K | 31.85 | 31.24 | 30.3 |
| Average of 4K | 4.107 | 23.88 | 4.576 |
| Average of 4KQD32 | 8.035 | 4.582 | 7.892 |
| WRITE | |||
| Average of Seq | 48.9 | 73.21 | 76.56 |
| Average of 512K | 24.05 | 23.88 | 72.42 |
| Average of 4K | 2.499 | 2.763 | 4.022 |
| Average of 4KQD32 | 1.997 | 2.816 | 4.667 |
| Compression Average of Seq | 40.835 | 50.91 | 55.165 |
| Compression Average of 512K | 27.95 | 27.56 | 51.36 |
| Compression Average of 4K | 3.303 | 13.3215 | 4.299 |
| Compression Average of 4KQD32 | 5.016 | 3.699 | 6.2795 |
| Gzip | |||
| READ | |||
| Average of Seq | 32.3 | 30.41 | 29.68 |
| Average of 512K | 32.07 | 30.43 | 34.5 |
| Average of 4K | 4.057 | 3.792 | 4.19 |
| Average of 4KQD32 | 8.01 | 7.053 | 7.187 |
| WRITE | |||
| Average of Seq | 13.13 | 15.92 | 57.24 |
| Average of 512K | 12.81 | 30.7 | 44.96 |
| Average of 4K | 0.5 | 0.932 | 4.487 |
| Average of 4KQD32 | 0.511 | 0.644 | 4.404 |
| Gzip Average of Seq | 22.715 | 23.165 | 43.46 |
| Gzip Average of 512K | 22.44 | 30.565 | 39.73 |
| Gzip Average of 4K | 2.2785 | 2.362 | 4.3385 |
| Gzip Average of 4KQD32 | 4.2605 | 3.8485 | 5.7955 |
| Gzip-9 | |||
| READ | |||
| Average of Seq | 30.11 | 28.51 | 30.58 |
| Average of 512K | 32.27 | 31.46 | 31.42 |
| Average of 4K | 4.227 | 4.652 | 4.571 |
| Average of 4KQD32 | 8.081 | 7.051 | 7.432 |
| WRITE | |||
| Average of Seq | 12.92 | 15.43 | 55.88 |
| Average of 512K | 14.84 | 16.65 | 37.9 |
| Average of 4K | 0.52 | 0.794 | 3.93 |
| Average of 4KQD32 | 0.47 | 0.554 | 4.014 |
| Gzip-9 Average of Seq | 21.515 | 21.97 | 43.23 |
| Gzip-9 Average of 512K | 23.555 | 24.055 | 34.66 |
| Gzip-9 Average of 4K | 2.3735 | 2.723 | 4.2505 |
| Gzip-9 Average of 4KQD32 | 4.2755 | 3.8025 | 5.723 |
| iSCSI, Compression | |||
| READ | |||
| Average of Seq | 78.04 | 81.96 | 79.08 |
| Average of 512K | 71 | 73.9 | 68.94 |
| Average of 4K | 3.854 | 4.619 | 3.59 |
| Average of 4KQD32 | 56.07 | 60.13 | 70.82 |
| WRITE | |||
| Average of Seq | 27.94 | 37.81 | 40.14 |
| Average of 512K | 23.5 | 45.85 | 46.35 |
| Average of 4K | 3.462 | 3.832 | 4.274 |
| Average of 4KQD32 | 10.72 | 0.994 | 29.99 |
| iSCSI, Compression Average of Seq | 52.99 | 59.885 | 59.61 |
| iSCSI, Compression Average of 512K | 47.25 | 59.875 | 57.645 |
| iSCSI, Compression Average of 4K | 3.658 | 4.2255 | 3.932 |
| iSCSI, Compression Average of 4KQD32 | 33.395 | 30.562 | 50.405 |
| Standard | |||
| READ | |||
| Average of Seq | 29.93 | 31.53 | 32.84 |
| Average of 512K | 32.49 | 31.27 | 33.59 |
| Average of 4K | 4.114 | 4.619 | 4.687 |
| Average of 4KQD32 | 8.168 | 7.482 | 7.634 |
| WRITE | |||
| Average of Seq | 50.17 | 11.81 | 60.99 |
| Average of 512K | 26.55 | 8.902 | 66.44 |
| Average of 4K | 4.05 | 4.28 | 4.501 |
| Average of 4KQD32 | 3.121 | 4.465 | 4.431 |
| Standard Average of Seq | 40.05 | 21.67 | 46.915 |
| Standard Average of 512K | 29.52 | 20.086 | 50.015 |
| Standard Average of 4K | 4.082 | 4.4495 | 4.594 |
| Standard Average of 4KQD32 | 5.6445 | 5.9735 | 6.0325 |
smells interesting.
Just to keep the licensing infos correct:
Nexenta Community Edition is not for production use. See 2.9 in EULA http://www.nexenta.com/corp/eula-nexentastor-community-edition
Thanks, I must have missed that in the license, glad you saw it. I’ve updated the post. Looks like the only free solution is OI.
I’m not sure what the units of measure are. Can you clarify? Thank you for the work!
Oh, doesn’t mean anything without the UOM does it? MB/s.