Netdata – The Hidden Gem of System Monitoring
Netdata is now my favorite system monitoring tool. It is not widely known. But it’s rapidly gaining popularity. Traditional system monitoring (Nagios, Zabbix, etc.) done right requires quite a bit of work. For smaller networks it’s almost overkill. It involves setting up a central network monitoring server, configuring agents to connect to it, and manually setting up sensors (or at best manually configuring templates to automate later). It seems every network monitoring solution tries to solve it the same way. But Netdata is different.
Netdata eliminates the need for a central monitoring server and automates the setup.
The steps to install and configure Netdata are:
- Install Netdata with one command.
- There is no second step.
Just go to the Netdata port in your browser, and you’ll see this:

Now you have more monitoring capabilities than you know what to do with. The screenshot above is just a tiny fraction of what is monitored. You can scroll down for miles on that page.
Here’s a live demo you can look at.
If you don’t care to get into the details, the top-right alert will indicate orange or red as problems occur. If you don’t see any warnings, you’re probably okay.
Alarms and Best Practices
Shortly after installing Netdata, it alerted me to some of the usual problems: High load, low memory, low disk space. But it also alerted me about performance issues I didn’t know I was having. One that was common across many of my servers was a warning that my VMs were running low on entropy. System monitoring is usually so focused on the basics like CPU and disk space. I can’t think of any other system monitoring tool that out of the box tells you your entropy is running low. For most issues, Netdata also offers a paragraph about what the problem is, the likely cause, and how to fix it—sometimes linking to external websites for further documentation.
In my case, Netdata suggested installing haveged on VMs to gain more entropy. I did and now my servers aren’t starving for entropy. Without Netdata I never would have known it was a problem and I likely at some point would have just thrown more cores at them.
Another time (and I did have to configure HA-Proxy to make it’s metrics available to Netdata) I had a pair of HA-Proxy load-balancers fronting a MariaDB Galera Cluster. One of the MariaDB nodes stopped responding. Netdata saw the issue and sounded the alarm. The thing to note is I didn’t tell Netdata to monitor for a specific down condition, I just configured Netdata to look at HA-Proxy metrics and this was one of the default alarms.
Automatic Service Monitoring
Netdata automatically configures plugins to monitor what’s on your server. Do you have NGINX installed? The NGINX plugin is enabled, and if 5xx responses go high, you’ll know. MariaDB? You’ll get insights into your DB query performance. Postfix? Well, now you’re going to be monitoring the queue. KVM, LXC, or Docker? It will watch your containers and VMs as well. You can spend months configuring Nagios or Zabbix to monior at this level of detail. But with Netdata, you get 90% of what you need automatically with little effort, and for the most part, you don’t have to tell Netdata what’s there. It finds it.
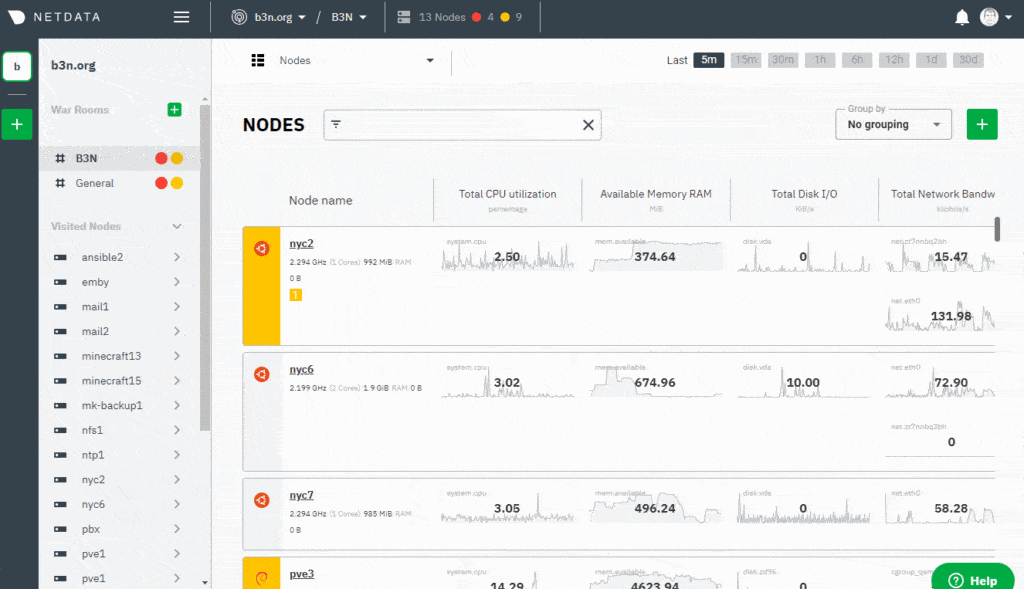
Have a fleet of servers? Netdata Cloud can aggregate them all under a single pane of glass. At a glance, you can see the health of your fleet.

I started using Netdata a year ago and now it’s the main monitoring tool I use.
Netdata Pros and Cons
Pro
- Simple setup for a small number of servers
- Finds potential causes to performance issues
- 80/20 of system monitoring. Gets you 80% of what you need with 20% of the effort.
- No agents to install
- Extremely light-weight. It has very minimal performance impact.
Cons
- Windows not supported
- Features are rapidly changing requiring frequent updates
- Does not have SSL
- No authentication other than IP restrictions. Designed to run on a management network.
- No GUI to configure settings, plugins, etc.
- It’s not designed to monitor services from externally. You would still want a traditional tool for that.
.